Interdependence
“Everything depends on everything else”
This daunting truism could have been the bane of any scientific study if it wasn’t for systems theory. Everything we study is a subsystem of something greater, bigger, more diverse. By focusing on one subset of the system, we make the assumption that the strength of internal interactions in relation to those that we declare to be entities outside of the system is relatively stronger and thus motivate us to try to think of a set of components as one system, constrained by external factors. For example, we can study one organism, which is a system of organs, and its relation to the external environment, like temperature. In theory, a warm blooded organism does also affect the environmental temperature, but we determine that the interaction strength going from the organism to the environment is sufficiently low as to treat is as an external factor. Another common reason for studying systems is an interest in interactions between components, or an interest in a phenomenon that is a consequence of the collective dynamics of the parts. A good example of the later is the study of trust between people which can only arise through repeated interactions and which is an emergent property of the social interaction system.
Since everything depends on everything else we know two things about any living system we choose to study:
1) It is made up of interacting components, and 2) it (and thus its components) interact with other components that are by more or less subjective definition external to our choice of system.
Determining sub-groups or modules
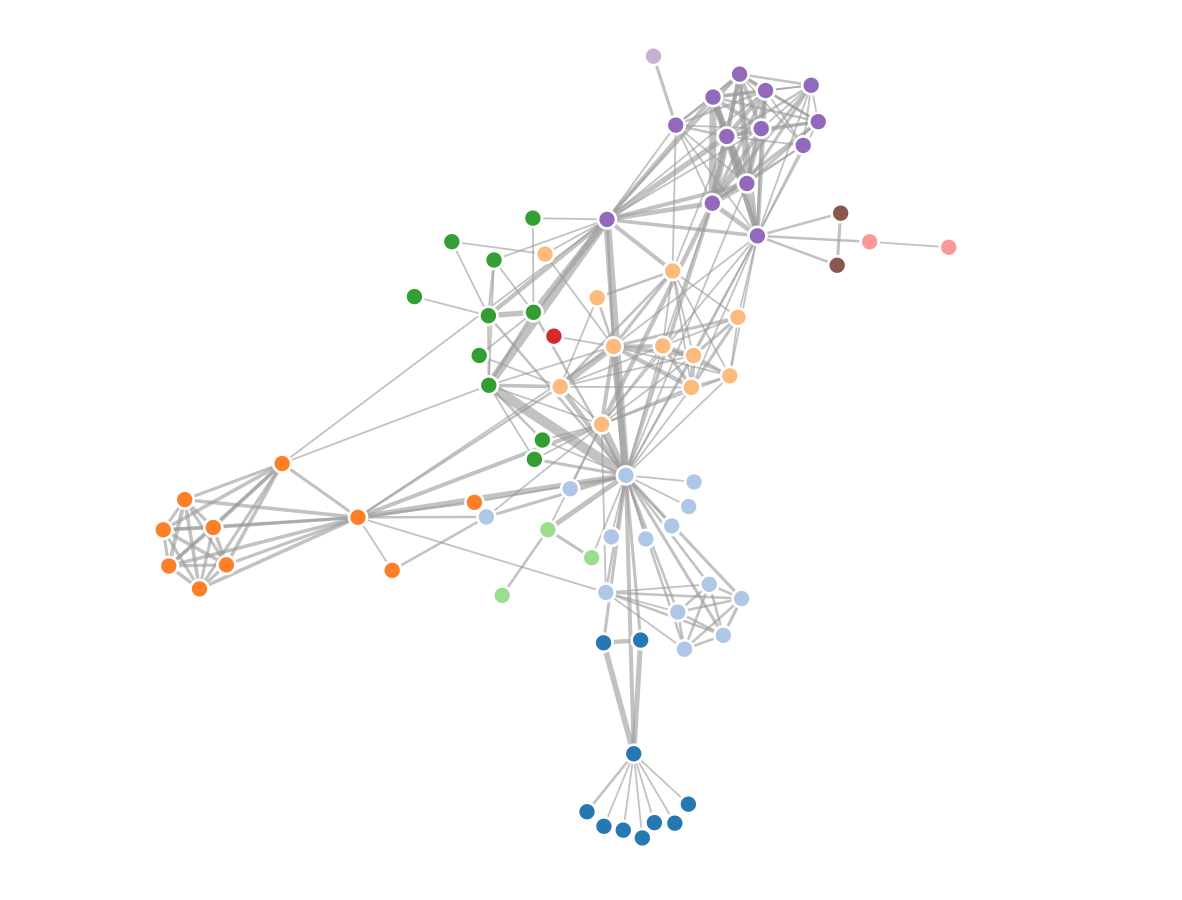
Say we are given a network as shown in the picture below. Think of the nodes as people and the links as frequencies of interactions. This particular network is based on te play le Miserables and the interactions are when characters are in the same scene. Assume you want to 1) know how many groups are in the network, and 2) study each group individually. How would you go about this? If you kept nodes with strong interactions close to each other and nodes with weak interactions as far away from each other as possible, you would start to see a pattern emerge as we do in this graph. But the whole system is still one system, everyone is somehow interacting with everyone else. But together, they create an overlapping story.
Social groups

There are other methods to determine how to define a subsystem. For example, one can use advanced network algorithms to identify clusters. Many of these algorithms come from social science that studies groups and clique formations in social networks. An example of this is provided by Daura-Jorge et al. (2012) who analysed social structure in dolphins in Laguna, southern Brazil which use a foraging tactic involving cooperative interactions with local, beach-casting fishermen. Interestingly, dolphins that had learned to cooperate with fishermen, also interacted more closely with each other
Another way to establish what is internal vs external to a system is to analyse time-series of the dynamics of each individual node. The degree to which nodes influence each other is reflected in the correlation over time which can then be used as a measure of interaction strength. This requires very intensive data sampling though.
Social networks in natural resource management
If we would ask what boundaries we would set in order to study a person’s social network we would typically think about the frequency of interactions a person has with other persons. This is what we would think of as the “horizontal” scale of the focus, the person. Increasing this scale would e.g. be to allow to include the interactions of the persons that our focus person interacts with, i.e. to follow the social network two steps. But we could also focus on understanding what groups of people the person interacts with. These could be, for example, work, family and sports activities. This is a shift in scale in the “aggregated” direction. We can increase the vertical or aggregated scale to look at which interaction a person has with people from 1) different neighborhoods, 2) municipalities, 3) countries. Lower scales for social networks than a single person are non-sensical, but for other questions, we can scale a person down by looking at organs, cells, molecules etc.
The point here is that we not only decide on a scale to focus on in the horizontal level (interactions with other people), but often make implicit assumptions on the vertical scale we are focusing on. To be aware of the aggregated scales of systems is important, as we will see in later sections, since they often have different time-scales also and interactions between systems with different time scales generate important phenomenon that are very relevant to understand some of the most intriguing dynamics displayed by CAS.
An example from a rural fishing village in Kenya
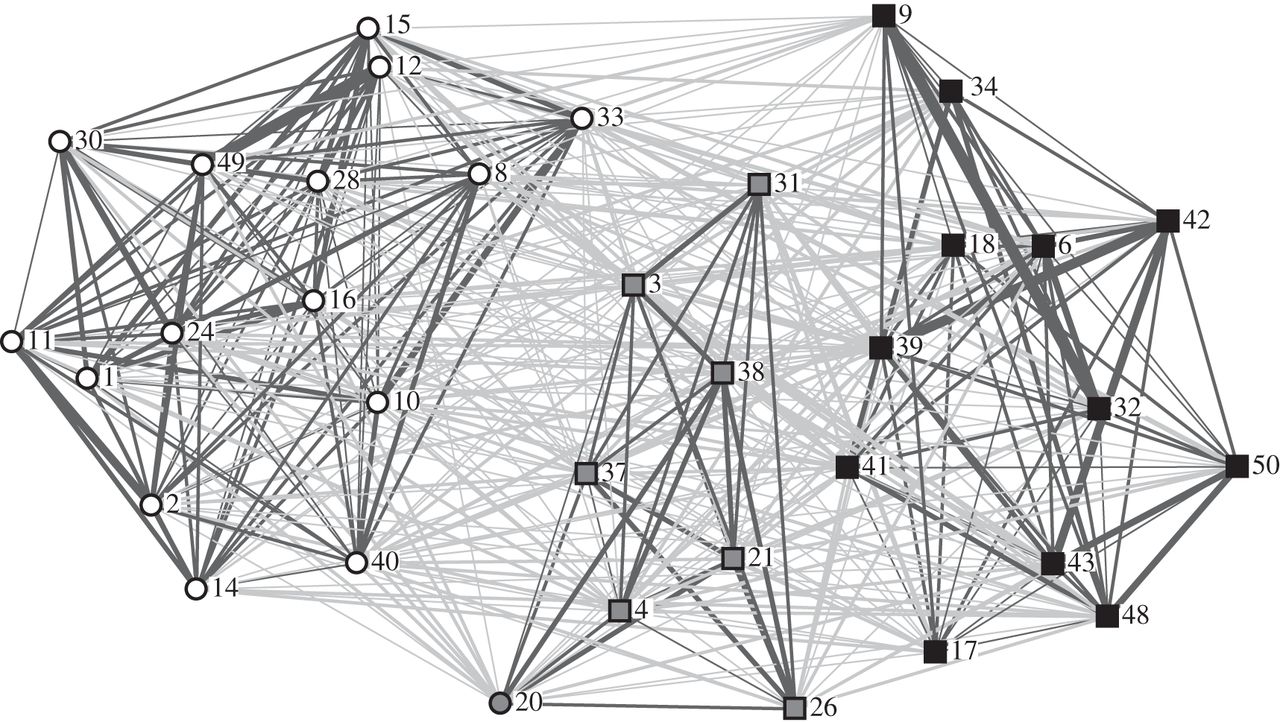
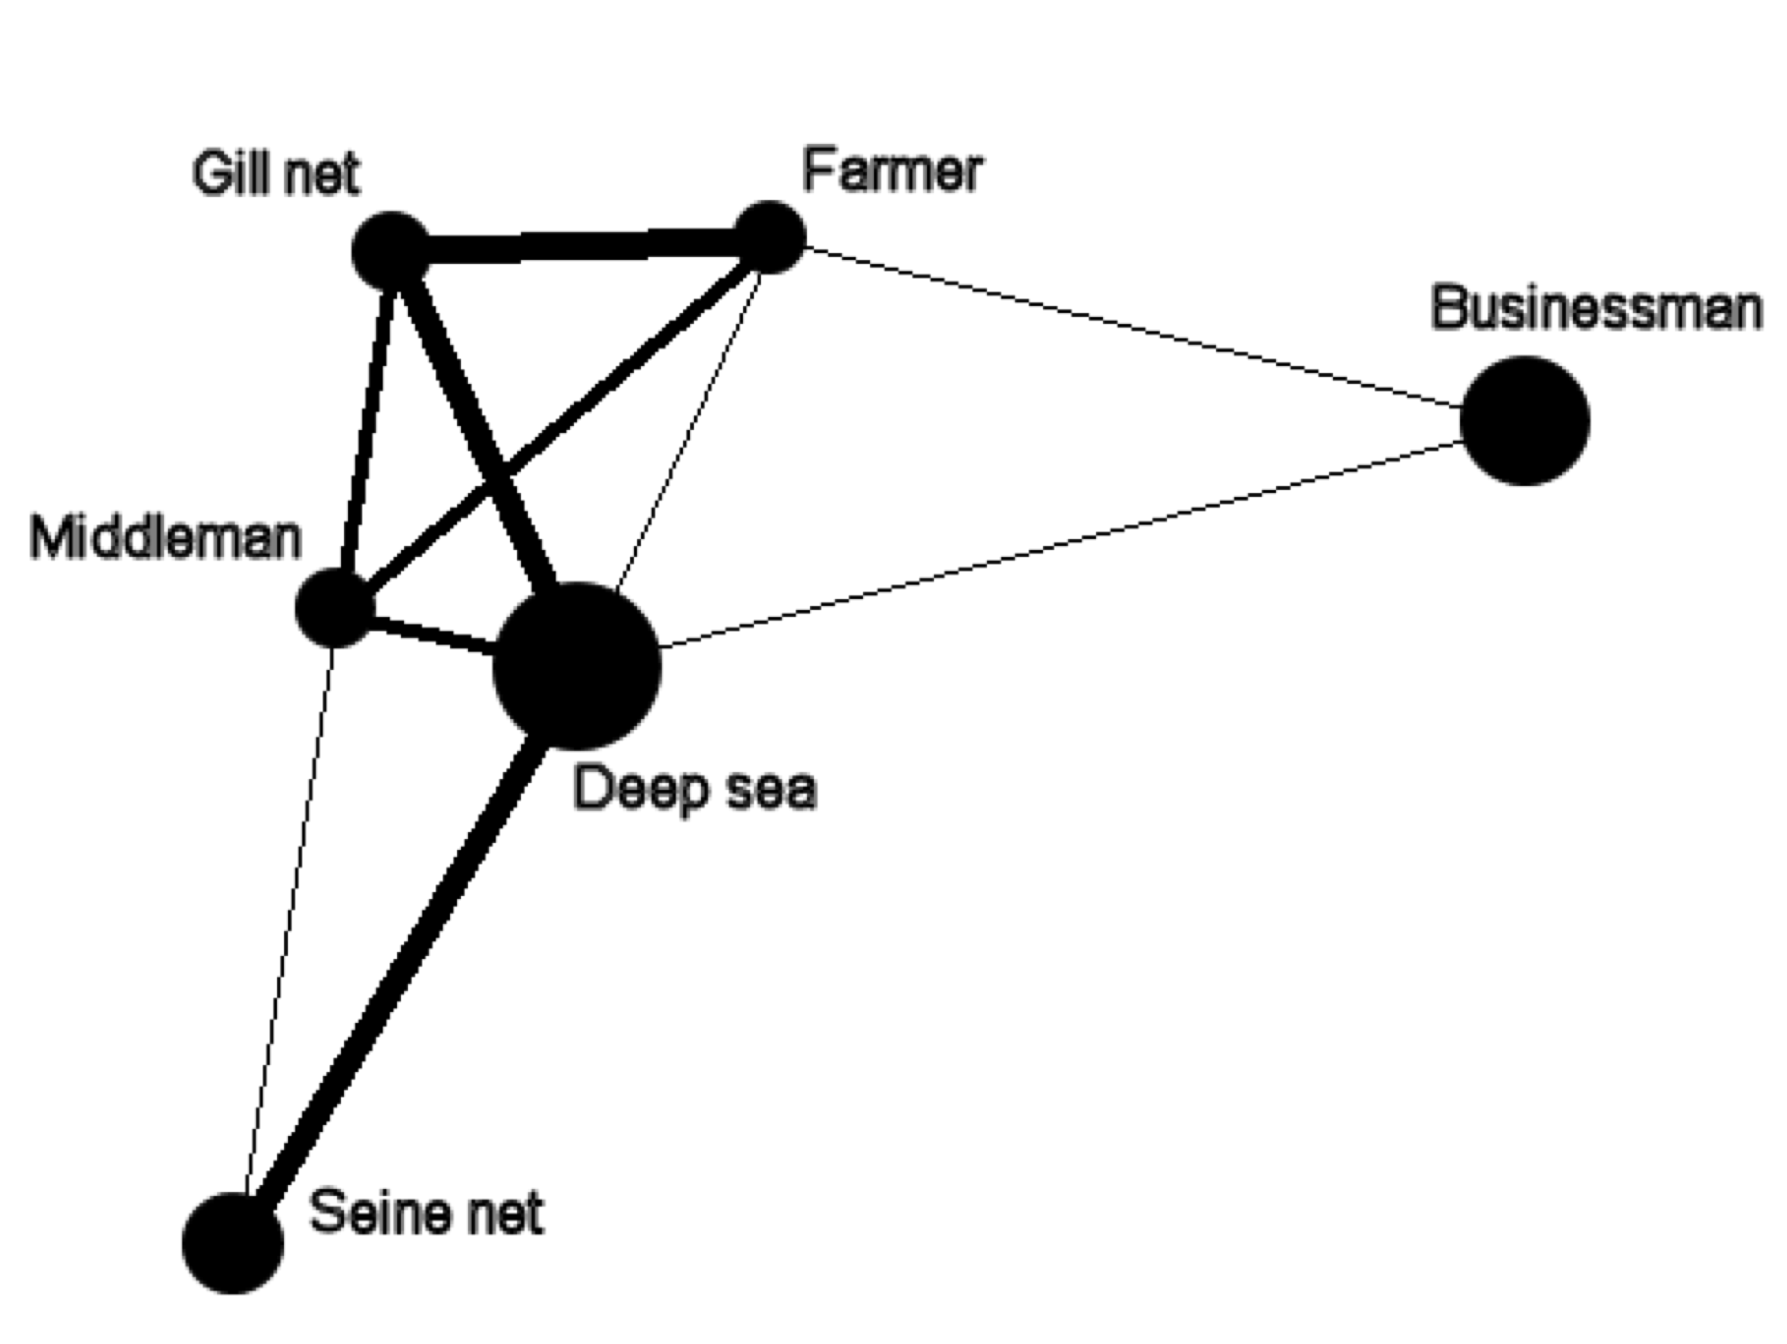 Beatrice Crona and co-workers (Crona and Bodin, 2006) conducted a survey among villagers in a rural fishing village in Kenya. Besides asking what their main occupation was they also surveyed the self-reported social ties between these villagers. The analysis was done at two levels. First, the ties between people belonging to certain occupational groups was mapped, revealing that e.g. gill net fishers and farmers were strongly connected whereas these had almost no ties to seine net fishermen. At the individual level (focusing on social structure only), one could see that even though clusters, (or modules) where distinctively different from each other, they also showed occupational diversity.
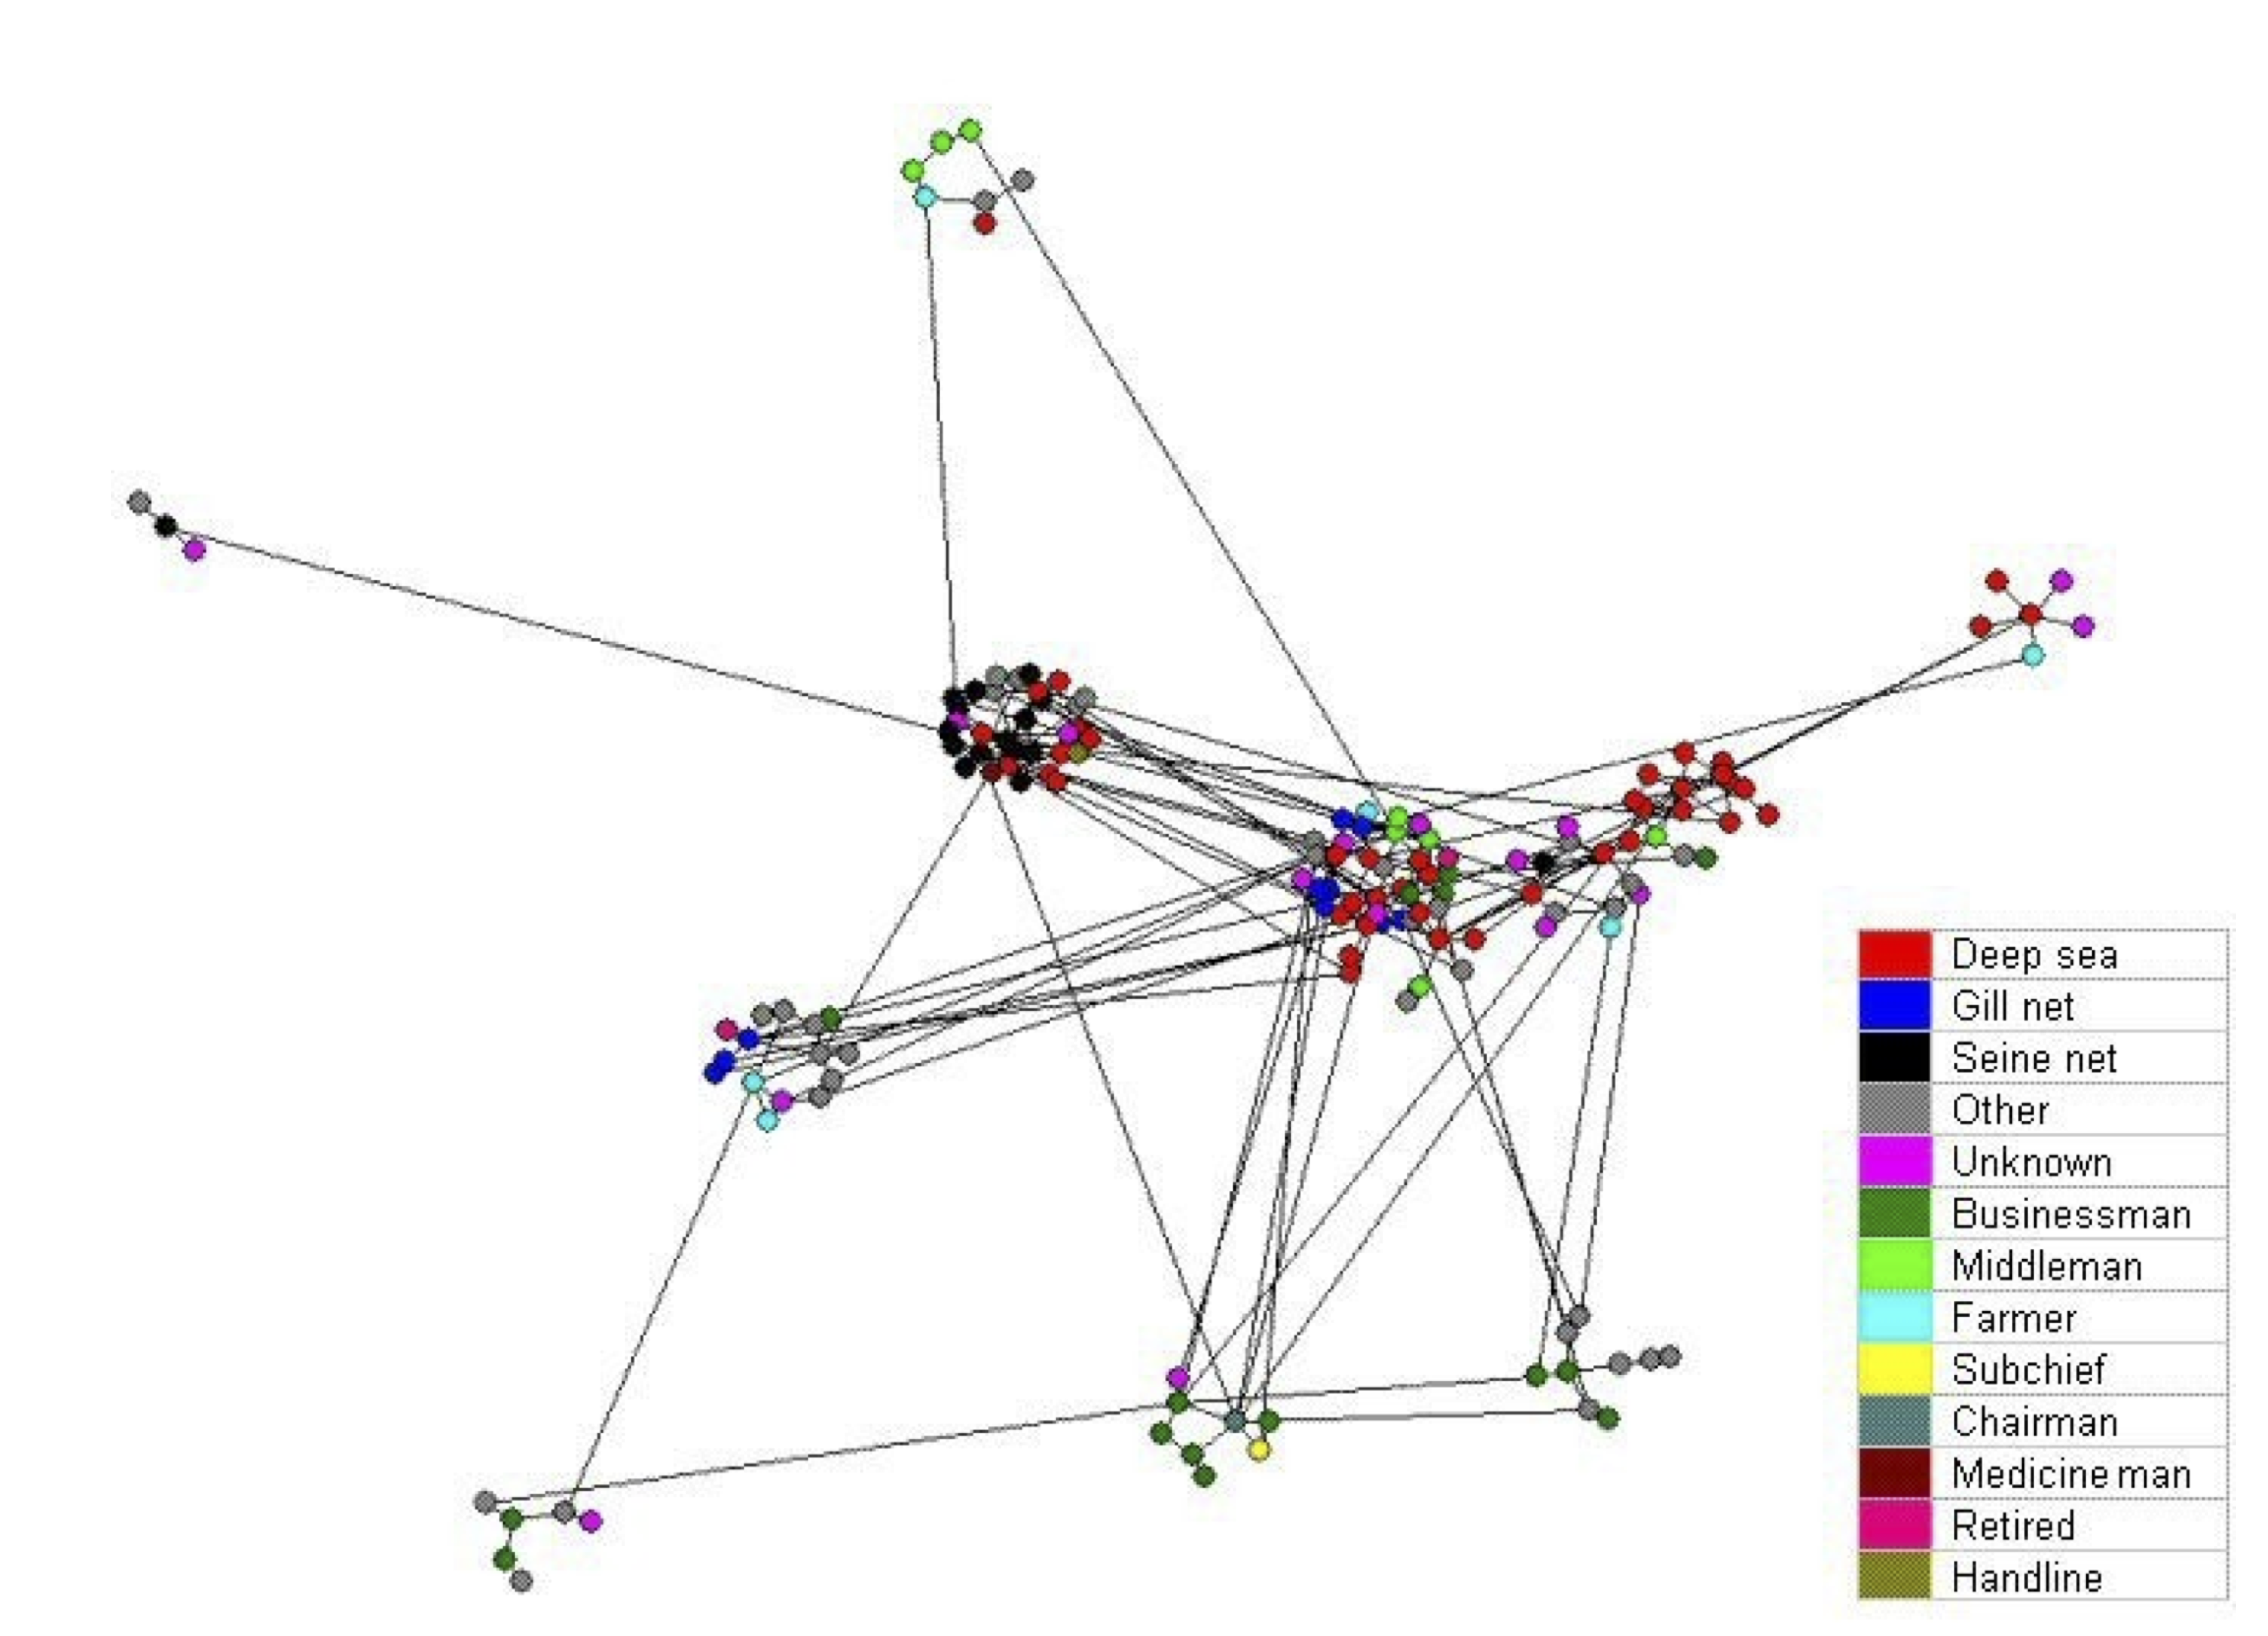
Results showed that communication occurs primarily between fishermen who use the same gear type, which may inhibit exchange of ecological knowledge within the community. This may partly explain why the community has been unsuccessful in regulating resource extraction, especially since potentially influential groups of non-fishermen have a limited communication with the various fisher groups. Analysis of network structure also shows that groups most central, and hence potentially most influential, are dominated in numbers by migrant deep sea fishermen, hypothetically less motivated to initiate collective action for resource management. Hence, we conclude that a lack of collective action to remedy an unsustainable situation may be attributed to various different but distinct aspects of the specific structure of the social network.
Coupled social-ecological systems
Social ecological systems present a particular challenge. There are very tight interactions within the social and ecological system warranting a traditionally separate analysis of the processes within these systems. But, as we have seen throughout this course (particularly in “reconnecting to the biosphere”) our dependence on ecosystem services and the enormous impact of human activities on the ecological system make it a necessity to understand them as one interconnected system. How to do this, is scientifically only in its beginning phase.
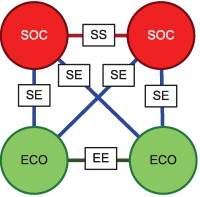
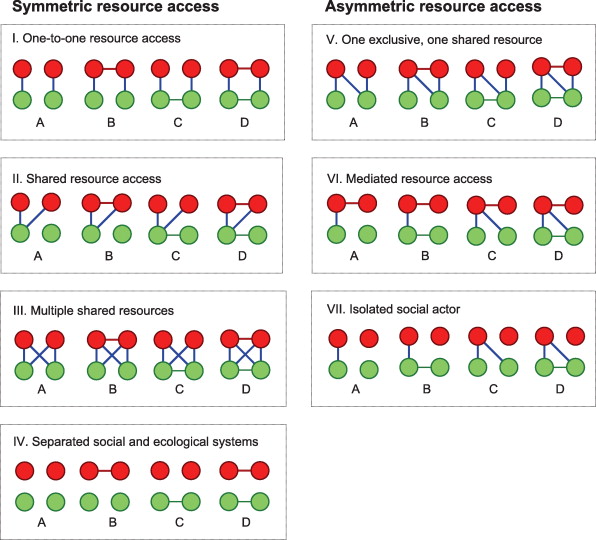
Bodin and Tengö (2012) introduced a very useful idea in order to start to understand what interactions are particularly common and following from that, which might be particularly important to understand for management. The idea is based on a minimal network of a social ecological system, with two human components (SOC: people or groups) and two ecological components (ECO: species or ecosystems). From these, they extracted all possible sub-networks and clustered them into network families.
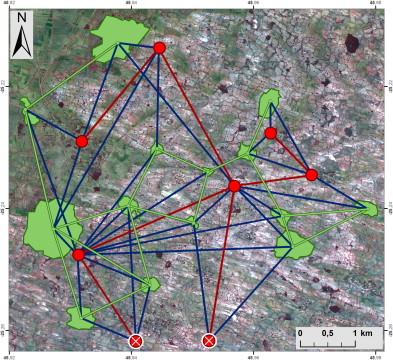
Next, they used a network based on the Madagascar case which we have described earlier in the topic on land use change to highlight potential links between the forest patches based on dispersal by animal vectors, as well as links between the social groups based on social relations. Lastly, they used surveys to assess which groups used which patches of forests. The resulting social-ecological network is seen in the figure below
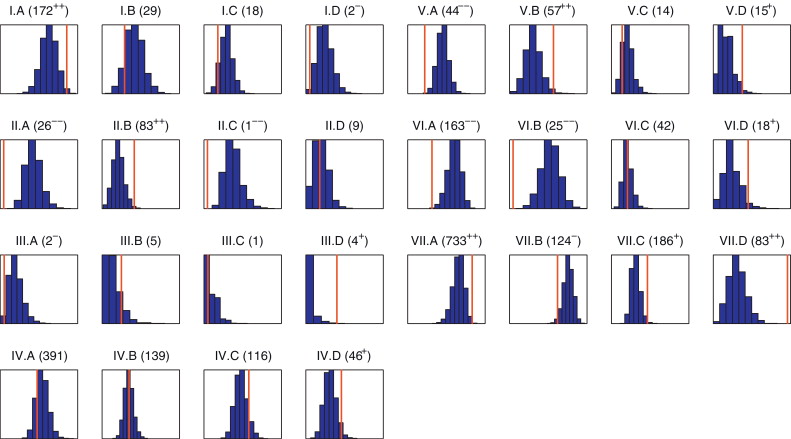
They proceeded by using a statistical method to determine the random occurrence of the particular sub-networks and compared this to the actual network they had established based on data (Figure below). First, they found that shared forest access (competition) generally implies social connectivity (II.B, III.D, V.B and V.D are overrepresented whereas II.A, II.C, IIIA, and V.A are underrepresented). This can be interpreted as resource sharing and competition is, in this study area, often accompanied with social connectivity that increases the potential for negotiating and regulating resource use. Secondly, the motif with all possible connections among the four nodes being realized (III.D) is also overrepresented. Hence, if the clans are sharing two patches, these patches are relatively often also ecologically connected, as are the clans. Thus, highly interconnected clusters of clans and forest patches are relatively common in the network. Taken together, by analyzing the motif-based SES fingerprint of the social–ecological network defining the study area, they were able to come up with some pending hypotheses that could partly explain the successful governance of the biodiversity rich forest patches. The clans are organized in relation to the forest patches so that shared forests are combined with social connectivity, which is a cornerstone of successful common-pool resource management as discussed earlier. Furthermore, there are several indications of a good fit in terms of social and ecological connectivity although this pattern is less pronounced.
References
Bodin, Ö., & Tengö, M. (2012). Disentangling intangible social–ecological systems. Global Environmental Change, 22(2), 430–439. doi:10.1016/j.gloenvcha.2012.01.005
Crona, B., and Ö. Bodin 2006. What you know is who you know? Communication patterns among resource users as a prerequisite for co-management. Ecology and Society 11(2): 7. [online] URL: http://www.ecolog yandsociety.org/vol11/iss2/art7/
Daura-Jorge, F. G., Cantor, M., Ingram, S. N., Lusseau, D., & Simões-Lopes, P. C. (2012). The structure of a bottlenose dolphin society is coupled to a unique foraging cooperation with artisanal fishermen. Biology Letters, 8(5), 702–5. doi:10.1098/rsbl.2012.0174
Leave a Comment