Markets
A market is one way in which parties engage in exchange. There can be no doubt that markets are one of the most powerful mechanism of human development providing incentives for technical and social innovation, increasing efficiency of production and providing income redistribution. As many other systems that include living beings, local choices that affect aggregate variables (like prices) which in turn affect behaviour patterns, markets and the economy at large is a complex adaptive system. As such, it is to a large degree self-organizing. The path of this self-organization does not necessarily take the direction that conforms with the goals of human welfare which is why, at times, markets need to be directed by different methods, such as taxation/subsidies or institutions.
We will here focus on markets that use money as a means of exchange, but other methods, such as barter, are also possible. We will also focus on competitive markets with sufficiently many consumers and suppliers i.e. no dominance of single actors.
To understand the benefits as well as the problems of markets, we first will look to understand an ideal markets, and then explore what happens when ideal situations are not valid. Ideal here means that resources are redistributed efficiently and egalitarian (i.e. not making any choices that are dependent on a particular person, all are equal) which does not imply just, ethical or equitable. We will address these issues as well as market failures later.
Ideal markets?
What is an idea market and are ideal markets to be considered a good thing? Given the loose definition we have given to markets above one might at first be inclined to think so. However this need not be the case. In the late history of economic thinking, economists have commonly preferred to distinguish normative economics (“what ought to be” in economic matters) from positive economics (“what is”). In the definition above, we clearly made a normative value judgement in the sense that we related the market outcome to that of a benevolent planner, i.e. the market serves a goal. How are we to determine what is benevolent? Should poor countries contribute equally to rich countries when combating climate change? The answer is subjective and may depend on who you ask. The reason why economists have tried to separate the two is that in doing so it becomes clear what part of a suggested policy is related to value judgements (normative) and what is related to actual observations (positive). Hence, whether you are to consider an ideal market as a good thing, should depend upon whether you agree with the underlying ethics associated with the resulting market allocation (i.e. the income/wealth distribution or who gets what in the economy.). However, regardless of your opinion, understanding ideal markets should be your first stepping stone, which will enable you to uncover clues as to how markets could improve (or make worse) matters in situations where households, communities, and government don’t work so well.
Demand side
In a market we have two main parties, the supplier and the buyers, the demand. Often the suppliers are enterprises and the buyers are households or other enterprises. To understand how prices affect supply and demand we need to use the concept of utility or usefulness, which is the (perceived) ability of something to satisfy needs or wants. Crucial for understanding markets is how utility changes with the quantity of a commodity that is exchanged. Particularly, we need to know how the utility of one additional unit of the commodity depends on the quantity, e.g. what is the difference in usefulness of one additional pack of milk when you buy one pack versus when you buy 10 packs. It is generally assumed that this utility, called marginal utility, decreases asymptotically with quantity. We illustrate this in the picture below.
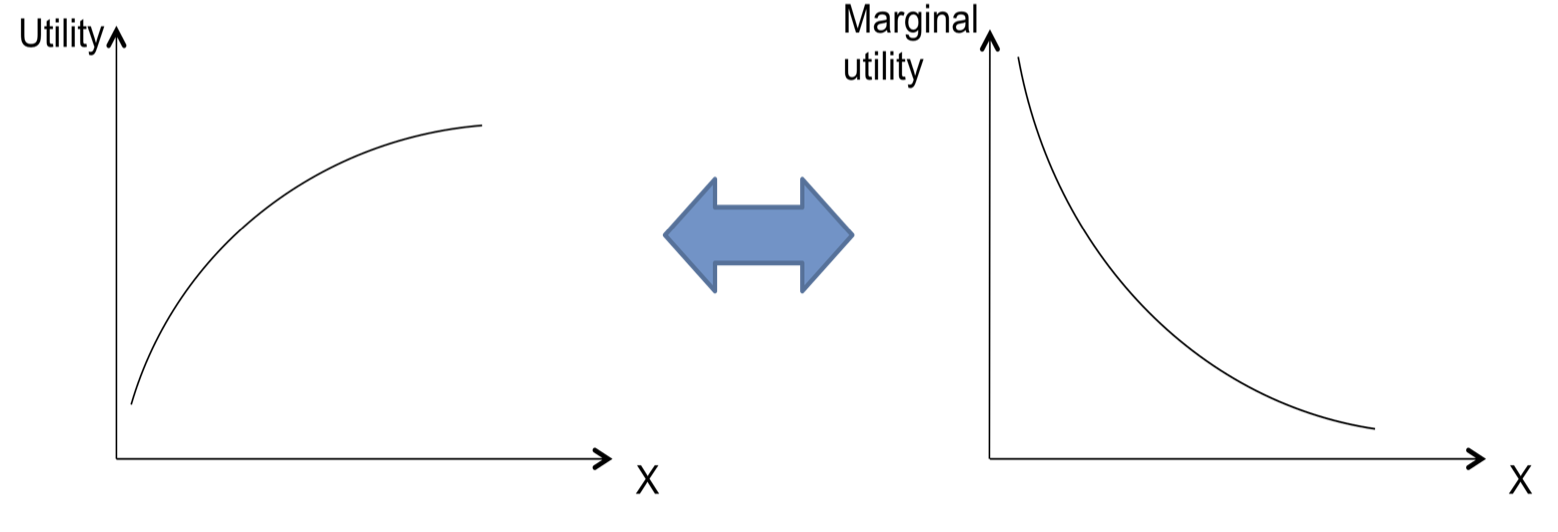
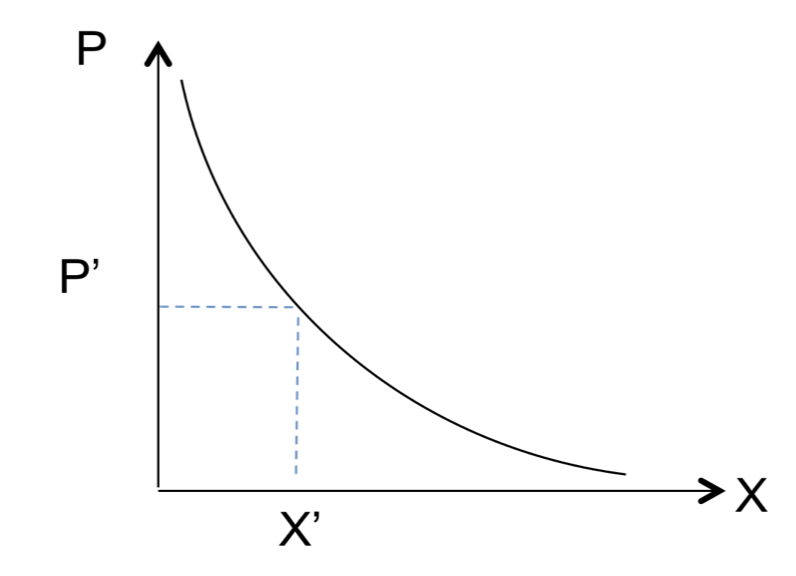
If we can quantify utility in monetary terms, we can then easily read out from this graph what quantity, X, would be desired given the price, P’, of the commodity.
Supply side
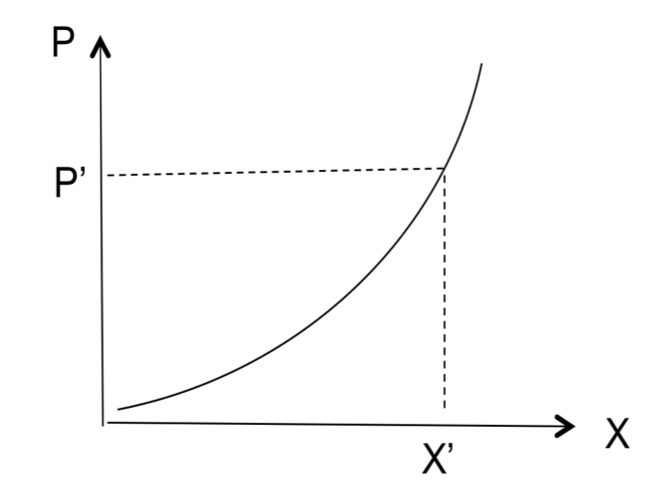
Let us now turn to the supply side. The equivalent of the buyer’s marginal utility for the supply side is the marginal cost of production, i.e. how much more would it cost to produce another item of the commodity depending on how much is produced in total. How do we expect this curve to look? One way of thinking about this is that production per unit decreases with quantity which is often true for commodities based on assembling raw products, i.e. the more raw product you buy the cheaper you get them. For a local fishermen, the amount of fish may on average be determined by the amount of time you spend. If this is the only consideration then one could expect a linear function. If, however, the cost of time increases the longer you fish, i.e. the lost opportunity cost increases as you have to forsake more and more important alternatives, you may get an increasing function.
Prices are the drivers!
It is easy to get confused by the fact that the price is here put on the Y-axis of the graph since this normally implies that price is the dependent variable, responding to the value on the X-axis, i.e. quantity. However, in reality this is not the case here and the reason is due to the historical development of the concept of supply and demand. Both consumers and suppliers will adjust the quantity bought or produced based on the expected prices, thus price, on the y-axis, is the driver for quantity bought or sold on the x-axis. Price elasticity is commonly used to describe the change in this behavior driven by prices. If elasticity is zero, then no change in quantity bought/produced occurs as price changes. Positive elasticity means more is bought/produced as prices increases, and the opposite for negative elasticity. Understanding price elasticities can help understand to what degree markets can affect e.g. food security and nutrition among poor people (see food production case).
Market equilibrium
We now have the components of a market and we can look at the end results and the dynamics of prices. Let’s look at the following figure:
We assume that we start off with the market not being in equilibrium. Both consumers and suppliers have an expected price on which to base their consumption and production. If the price is higher than the intersection of supply and demand, consumers will buy less than producers supply. This will, in the next step induce a reduction in price from the supplier side which in turn increases consumption. This is an adaptive and iterative process. You can see that over time, the market system will tend towards an equilibrium. Try to move the price (orange line) down towards the equilibrium, the green point. Now assume that something changes, new production technologies, or alternative goods that affect the marginal utility of the supplier and consumer respectively. You can simulate this by moving e.g. the red or blue cross. Now the market should be off equilibrium again, but the adaptive process will ensure the price dynamics try to catch up with the new equilibrium. The green point acts as an attractor for the system, and due to the fact that supply and demand curves can change over time, we can think of this as a dynamic attractor.
Market equilibrium
In the classical model aka cobweb model which may be the one you most likely have seen in economic textbooks, one can calculate the conditions for stability of prices under the assumption of complete market clearance. However, this approach is often unstable and only under very specific shapes of the demand and supply curves does the model converge to a stable price. The main assumption, i.e. perfect market clearance, is however, very seldom the case and both producers and consumers adapt their strategies in a more stepwise manner rather than assuming they have complete understanding of the response of consumers or suppliers. The adaptive process is much more stable in converging towards a price where supply and demand meet. Note however, that due to shifting preferences, technological change or other external factors, the shape of the supply and demand curves constantly change and thus the endpoint of the price. Thus, prices are in practice always dynamic, but the adaptive change explains why the markets are so good at tracking this change, albeit with a slight delay. In very fast markets, such as stock trading where autonomous software makes decisions in nanoseconds, the prices reflect almost instant changes in the demand and supply.
Contributors
Thomas Hahn, Jon Norberg
Leave a Comment