Land use
Social-ecological dynamics of the Norrström Drainage Basin
The Norrström Drainage Basin (NDB) surrounds Lake Mälaren (59°25’N 17°24’E) is the third largest freshwater lake in Sweden and supports 2 million people, including the capital Stockholm, with drinking water. The watershed of 22 650 km2 covers a heterogeneous landscape with multiple land uses; agriculture, forestry, wetlands and built up land. Approximately a third of the Swedish population lives in the region (three million). Most of them in cities and there is a general increase in population as well as in the degree of urbanisation. NDB comprises six county administrative boards and 54 municipalities. A significant part of Stockholm, the capital of Sweden, and its suburbs are located within NDB, making it one of the most densely populated basins in Sweden (Darracq et al. 2005). From an international perspective, NDB stands out due to a history of long-term urbanization, a long tradition of urban planning and present export of urban planning ideals to other regions with rapid urbanization (Borgström 2011). Much of the following text is assembled from publications within the EKOKLIM project at Stockholm University. Some sections, like the historical background and land use change are directly copied from forthcoming papers. The original source will be added as they become published.

Land use change in NDB over time
During the last ice age, the ice sheet suppressed NDB below sea level. Approximately 5000 years ago, land uplift raised NDB above sea level and the land was colonized by humans practicing farming. Hence the region has a continuous history of anthropogenic impact, primarily through subsistence agriculture (Barthel et al. 2005).
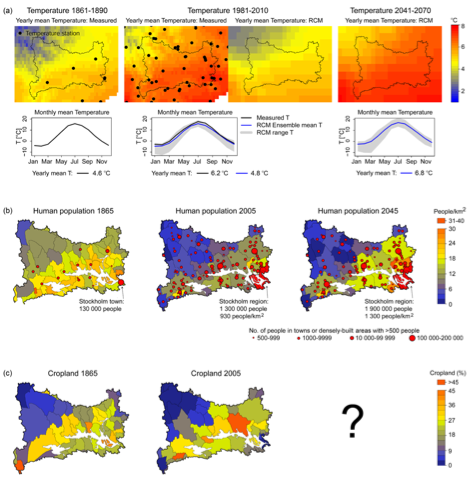
Since the mid-19th century, mechanization of agriculture and human population growth and urbanization have been important drivers of land-use change in NDB. The agrarian revolution reached Sweden in the 19th century, when mechanization of agriculture indirectly allowed urbanization and industrialization. These processes were associated with land-use changes which culminated in the 1930s (Cousins 2009). There was 18% cropland in the NDB landscape in 1865. In 2005 there was 16% cropland. Although there was little change in the total amount of cropland, its spatial distribution changed. The proportion of cropland was higher around Lake Mälaren in 2005 than in 1865, but lower in the low-productive north-east and the urbanized Stockholm region. The human population in NDB tripled in size between 1865 and 2005, from 807 000 to 2.6 million people. This was a period of urbanization as well as simultaneous depopulation of rural areas. In 1865, 22% of the population lived in towns, while in 2005 90% of the population now live in urban areas. Only 6% of the districts had a rural population density of <10 people/km2 in 1865, compared to 49% of the municipalities in 2005.
A typical farm in NDB in mid-19th-century had relatively small crop fields and large areas of grazed semi-open grasslands (Cousins 2009). Forests were grazed by livestock and relatively open (Emanuelsson 2010). Old forests were also rare because of a regional iron extraction industry and an associated need of fuel wood. From the mid-19th century, wet and moist habitats were drained to increase production (Antonsson and Jansson 2011). Efficient ploughs allowed cultivation of clay-rich soils, which were transformed from grassland to cropland. The amount of cropland increased until the 1930s after which less productive arable land was converted to forest (Cousins 2009). To promote forest growth and silviculture, livestock grazing in forests were banned in the 1930s. In productive regions, e.g. around Lake Mälaren, most traditional farms were merged into larger and intensively managed farms with high use of fertilizers and pesticides, a process which still is ongoing (Nykvist 2014). Both evapotranspiration and variation in daily runoff increased with cropland area and crop production in the early 1900s, but then stabilized or decreased. This change suggests that increased crop production was associated with greater water use which altered the water circulation in the landscape, despite the fact that irrigation is rare in NDB (Destouni et al. 2013, van der Velde et al. 2014). Moreover, urbanization and agricultural intensification have led to water pollution and eutrophication in NDB and coastal waters in the Baltic Sea (Darracq et al. 2008).
Present land use in NDB is dominated by forestry and intensive crop production with scattered remnants of semi-natural grasslands and deciduous woodlands (Sporrong 2008, Cousins 2009). NDB is located at the interface between the boreo-nemoral mixed-forest biome and the boreal coniferous forest biome. The boreo-nemoral biome is globally vulnerable because of far-reaching habitat conversion relative to the low proportion of protected habitat (Hoekstra et al. 2005).
Future challenges
Urbanisation From a global perspective, Sweden and NDB has a high degree of urbanization, however, this is related to the Swedish definition of urban, cities and towns, which is very generous. Projections suggest that several urban areas will continue to grow. For example, the Stockholm region will increase from 1 290 000 people to 1 850 000 by 2045. In south-eastern NDB, population densities are projected to increase also in rural areas, possibly due to urban sprawl where people commute between work in urban areas and country-side homes. In contrast, depopulation of north-eastern NDB is projected to continue, both in rural areas and small urban areas. This urbanization could maintain the trend of decreasing cropland area in low-productive regions and urban dwellings. However, several other scenarios may arise depending on the course of local-to-national policies (e.g. increased demand of locally produced food) as well as global development (e.g. higher energy prices). (Elmhagen et al in press)
** Some observed national urbanisation trends (Borgström & Schewenius, 2014) **
- An increasing number of new developments since the 1990s are explicitly focused on sustainability and support of the environment and ecological functions. Two examples include: Hammarby Sjöstad and Norra Djurgårdsstaden (in Stockholm) and Västra hamnen (in Malmö).
- Initiatives to renovate the so called Million Program Housing areas from 1960s-70s, quickly constructed concrete apartment complexes built to accommodate the then-influx of workers to the urban areas. Strategies focus on making the buildings more sustainable, for example through enhancing their energy efficiency. One example is Järvalyftet in Stockholm.
- Many Swedish cities have adopted a densification strategy in order to decrease urban sprawl and enhance energy/transportation efficiency. One example is urbanisation on former industrial and dockland sites.
- Strong market forces impact the power balance between private interests and municipalities in land use decision-making processes. This is one reason for the large increase in the establishment of shopping and entertainment centres in the peripheral zone of the cities since the 1990s that contradicts the general densification strategy.
Climate change
Temperature increase: The measured mean annual temperature in NDB was lower in the mid-19th century than at present (4.6°C in 1861-1890 and 6.2°C in 1981-2010) (Elmhagen et al in press). By 2014-2070, the mean projection of the models suggests a 2.0°C increase in mean annual temperature compared to the temperature estimated for 1981-2010. If the projection correctly represents the degree of increase, we can expect an increase in measured temperatures from the current annual mean of 6.2°C to 8.2°C. New analyses indicate that north-western NDB had lost its boreal climate conditions by the end of the 20th century (Fig. 2a). Continued warming could imply a loss of boreo-nemoral climate conditions by the mid-21st century. During the climatic 1960-1990, a mean annual temperature of 7-8°C characterized the nemoral vegetation zone in Sweden (SMHI 2013), which is located 500 km south of NDB. In a climate change perspective, NDB may face substantial changes in landscape composition since climate warming may improve the potential for agricultural production. Hence, low-productive soils within NDB, which have been forested since the 1930s (Cousins 2009), might be reclaimed for agricultural production. This would strengthen the development towards a binary landscape dominated by intense forestry and agriculture. Increased water use for agriculture and energy production in upstream parts of the basin might in turn change the water flow and downstream potential for fisheries and other ecosystem services (Destouni et al. 2013). (Elmhagen et al in press)
Precipitation increase: The main projected impacts from climate change in the region are: increased precipitation and as a consequence a risk of flooding; water pollution; and eutrophicated runoff water, which will among other things impact water quality and related ES negatively (Stockholms länsstyrelse 2011:2). There will also be an increase in the frequency of extreme weather events adding magnitude to these changes. These prognoses has resulted in a prolonged process of changing the capacity of the outlet of Mälaren through Slussen located in the city of Stockholm. Depending on how the capacity is changed it will result in different impacts on land use in shoreline locations in NDB. This has resulted in conflictual situations between, for example, nature conservation interests and landowners. Another challenge is the increased risk of saltwater intrusion into the Lake Mälaren as a result of sea level rise, which is a severe threat the to the provision of drinking water. (Nykvist et al, forthcoming)
Water quality
Within the institutions of the Water Framework District of North Baltic (including NDB) the local and regional authorities and actors have formulated a six year program of activities in order to reach the environmental quality norms of good chemical and ecological water status in Lake Mälaren and tributaries. This program emphasizes the challenges of acidification, eutrophication, pollution, invasive species, land use change, water use, protection of drinking water sources and climate change that needs to be managed to secure the water quality in the district (Vattenmyndigheten 2009).
Spatial distribution of ecosystem services
The benefits that people gain from the environmental features of the NDB are hereforth referred to as ecosystem services. Ecosystem services are the benefits provided by ecosystems to humans, both directly or indirectly. They are often categorised as supporting (e.g. soil formation, nutrient cycling), regulating (e.g. water regulation, pollination, flood mitigation), provisioning (e.g. food, fiber, fuel), and cultural services (e.g. recreation, aesthetic values). Society is dependant on ecosystem services for survival and development. Ecosystem services are a combination of ecological functions and people’s demand, management and use of them, therefore, where they can and do actually occur is spatially explicit and depends on the social-ecological system.
There is a wide range of ecosystem services in the NDB. In recently completed work, sixteen ecosystem services were mapped across the broader region. The unit of analysis was the municipality so the spatial distribution alludes to the pattern of ecosystem services at the broader regional scale. Each municipality, therefore, has an average level for each of the services within it, and the level expressed is relative to all the other municipalities.
In some cases it is possible to use land use as an indicator of an ecosystem service, particularly provisioning services. Forest products, for example, use the percentage area within a municipality that is classified as productive forest. On the other hand, some services are not visible by just looking at land use. Other kinds of variables are needed to show some provisioning and several regulating and cultural services.
The spatial distribution of a particular service is always the result of a combination of multiple factors. For instance, the presence of summer cottages is both a product of the high demand for holiday homes in densely populated areas and the proximity to coastal zones, more popular for summer recreation. Also, while the demand for cultural services is elevated in Stockholm, high population densities constrain the expression of services such as outdoor recreation and moose hunting, which is higher in lower populated forested areas distant from Stockholm. This is due to both ecological factors, such as the lack of large connected semi-wild ecosystems in cities, as well as restrictions on hunting on urban areas.
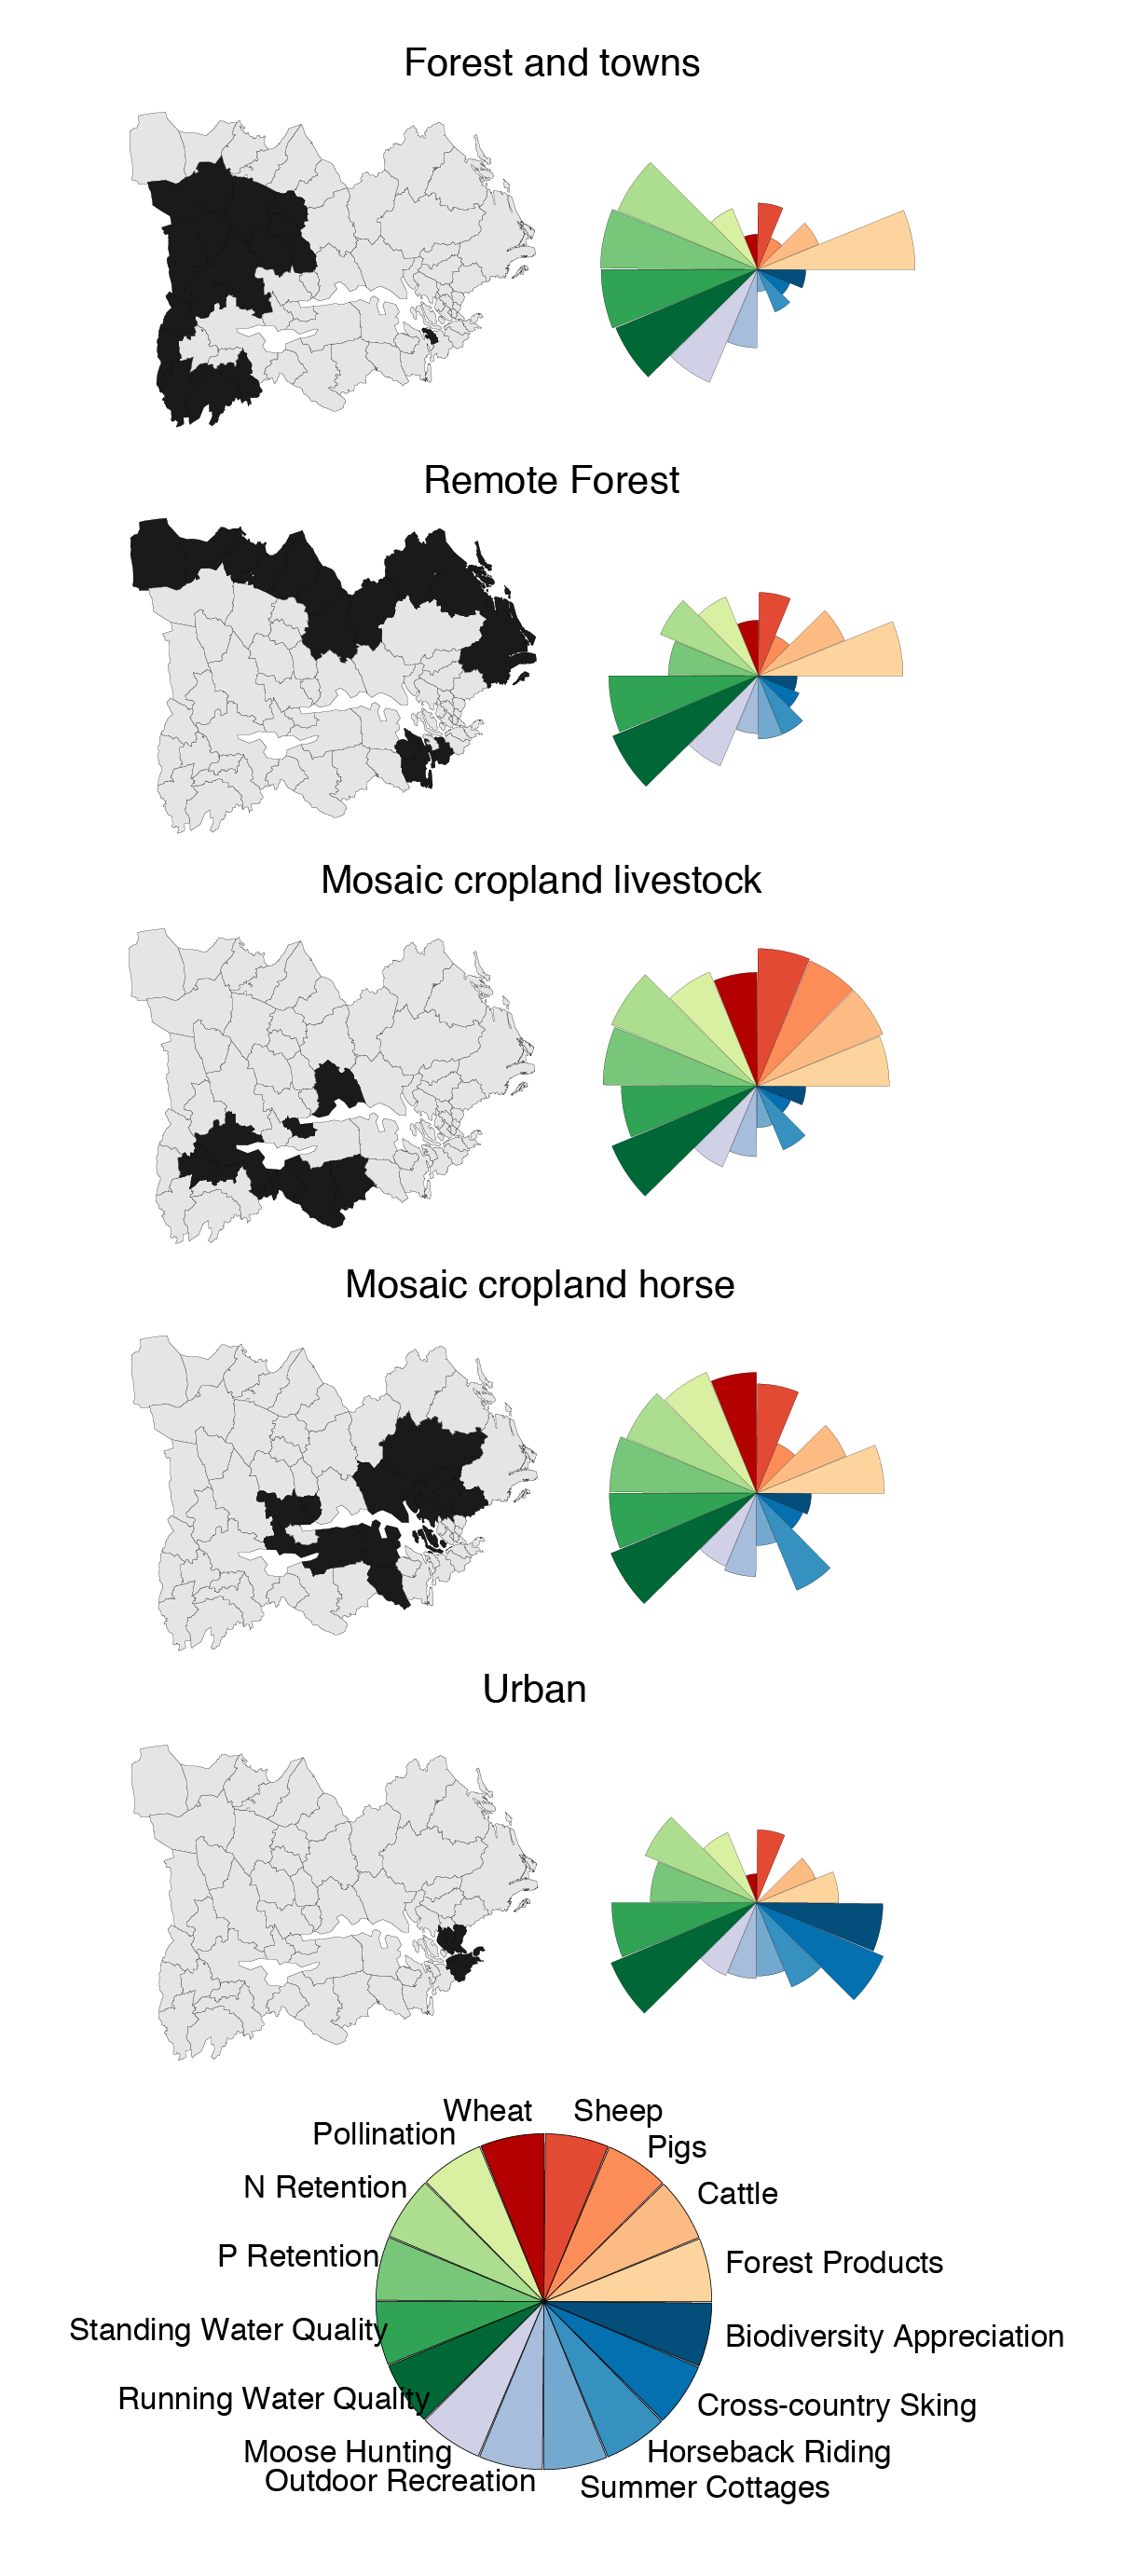
Ecosystem services are not independent of each other. They can rely on or compete for the same enabling factors. Patterns of trade-offs and synergies between services are expressed through bundles of ecosystem services. Bundles of ecosystem services are common sets of ecosystem services that repeatedly appear together. In the NDB all the municipalities fit into one of five types of bundles.
There are two forestry dominated bundles; (1) remote forest and (2) forest & towns. Both supply forest products, but remote forest has lower levels of nutrient retention. There are two mosaic cropland bundles; (1) mosaic cropland horse and (2) mosaic cropland livestock. Both of the mosaic cropland bundles are highly multifunctional, but mosaic cropland horse has a greater emphasis on the cultural service of horseback riding. The urban bundle highlights the fact that many cultural services are more abundant where there are more people. The bundles are geographically clustered in the region.
Using an ecosystem service lens, particularly using the concept of bundles, in environmental planning and policy making has three key benefits: First, by highlighting interactions among services, it discourages interventions to enhance a single ecosystem service, such as carbon sequestration, without thinking about its impact on other ecosystem services. Second, it can help identify interventions that can have simultaneously desired effects on multiple ecosystem services. For example, in this study area, measures directed to the enhancement of green areas in the Stockholm region could be designed to benefit a variety of services such as cross-country skiing, biodiversity appreciation and water quality. Third, by identifying types of bundles of ecosystem service, decision makers can focus on the potential for shifts between these types of bundles, and identify where, when, and how such shifts are possible or desirable. In our study, municipalities that were less typical from each bundle group had a likely high potential for the implementation of practices or management strategies that could lead to a change in the balance of ecosystem services.
Spatial patterns and correlations in ecosystem services
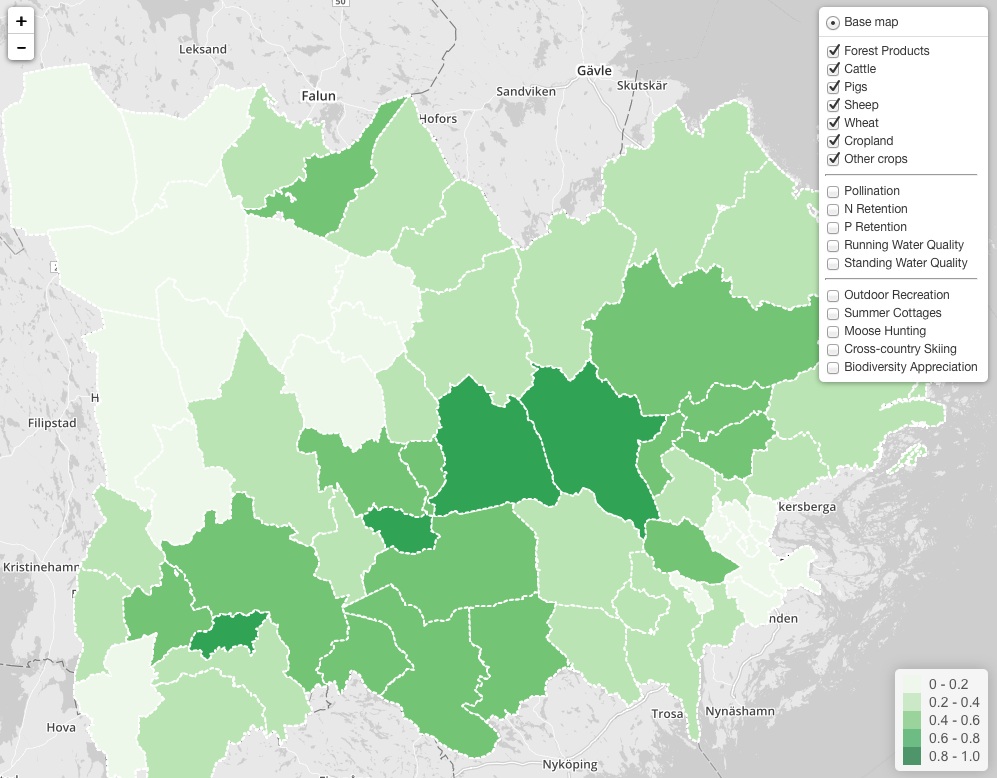
Exercise:Open the link and look at the distribution of different ecosystem services in the Norrström area. If you select multiple services you will get an average index of them. See how individual services are distributed across the landscape. Then try to group them into provisioning, regulating or cultural services. Can you get a feeling for how different regions are in terms of what they provide? Why do you think areas close to Stockholm often have high cultural values? Remember how ecosystem services are generated….
Advanced: Both in the previous topic on ecosystem services, as well as in the text above, we have highlighted the bundles of services provided by single units. Since social-ecological systems are highly dynamic, we can anticipate both intentional and unintentional change, e.g. through land use change. How does this actually translate in changes in ecosystem services? To understand this one needs to understand the correlation between different services. In the study by Queiroz et al. (2015) this was addressed by looking at the cross-correlations between all measured services. Take a close look at the following figure and try to think about how policies to restrict or promote certain services, such as horseback riding, pig farming etc., could have indirect effects on other services. In the figure you will see the correlations between different services are shown as red (negative) or blue (positive) and with ,, denoting the degree of significance.
Environmental governance of the NDB
Sweden has three political levels elected by the people: the Parliament, 21 County Councils and 290 Municipalities. The Government Office (Regeringskansliet) delegates the governmental tasks to 11 ministries divided into sectors, e.g. the Ministry of the Environment (Miljödepartementet). Implementation of policies and directives are performed by a number of agencies/boards also organised based on different sectors, e.g. the Swedish Environmental Protection Agency (Naturvårdsverket). The 21 County Administrative Boards (Länsstyrelser) are responsible for the national policies at regional level. Depending on the region, the tasks handled by the County Councils differ. Sweden has a long and strong tradition of urban planning and public participation is mandatory at municipal level. Sweden has a decentralised political system with a high degree of decision-making power and dependence on local fiscal revenues, encourages municipalities to expand their populations.
The main legislations that steer environmental decision-making in Sweden are: the “Environmental Act” (Miljöbalken) (Swedish Parliament, 1998), the “Forestry Act” (Skogsvårdslagen) (Swedish Parliament, 1979), the “Planning and Building Act” (Swedish Parliament, 1987) and the “EU Water Framework Directive” (European Commission, 2000). In the context of urban environmental governance, the application of both the “Planning and Building Act” and the “Environmental Act” are perceived as especially challenging and confusing. The Environmental Act is an umbrella legislation that incorporated a number of environmental legislations into one frame. This new, holistic legal frame of Swedish environmental governance has since been realized under the framework of the National Environmental Quality Objectives, NEQO (decided in 1999, and extended in 2005, Environmental Objectives web site 2014-11-24). The NEQO’s generation goal is overarching the twenty-four milestone targets and the sixteen environmental quality objectives (ibid). Out of the sixteen objectives, fourteen are perceived by the Swedish EPA as impossible to reach by 2020.
Sweden also has a strong tradition in local public associations (föreningsliv) for creating public opinion, education or recreation as well as for adult public education (folkbildning). Hence beside formal actors, these long term NGOs are often counted on as partners in network organisations and as representatives for public interests in different processes lead by the authorities.
Based on (Borgström & Schewenius, 2014)
NDB multi-level governance complexity
There is no administrative body that matches NDB and the governance landscape changes depending on focal issue. Of key importance are the counties and municipalities as well as the Water District Administration, regional co-ordination bodies and regional level interest organisations.
A particular challenge for the Stockholm-Mälaren region is the heterogeneity among counties with respect to economic prosperity and environmental performance. On the one hand, this region is the geographical home of the national government, and Stockholm county (Stockholms läns landsting) has developed forceful regional planning processes. The wider Stockholm-Mälaren region, on the other hand, with all the counties around Lake Mälaren, has considerable challenges to face in terms of further needs of streamlining the regional governance in a stronger and more collaborative way. While the municipalities within the region have rather strong and semi-independent governance capacities in themselves, the collaborative functions at county and regional levels need further development as the joint regional challenges increase in importance - as the low carbon transformation processes illustrate in a clear way. Obviously more of lateral and vertical collaboration seems to be needed. There is a strong focus in the political and planning communities in the region (but also among industrial actors) on transport and physical mobility in combination with issues around work-places and housing.(Liljenström, 2014). The council for the Mälaren region (Mälardalsrådet, including Stockholm) is an association of local and regional authorities in the larger region surrounding Lake Mälaren and their current focus areas are infrastructure, benchmarking and education (Mälardalsrådet web site, 2014-11-24).
Governance of water in NDB is highly dispersed over a range of actors both vertically and horizontally (Nykvist et al forthcoming). Since the formulation of the European Water Framework Directive the NDB and mid-Sweden coastal zone of the Baltic Sea is administratively managed by the North Baltic water district authority. The formal responsibility for water issues are furthermore divided by seven County Administrative Boards and more than 70 municipalities. Of importance for local and regional actor collaborations regarding Lake Mälaren is also the Mälaren Water Council (Mälarens vattenvårdsförbund web site, 2014-11-24).
SRC based research projects in the area
ARTS: Accelerating and Rescaling Transitions to Sustainability is a EU FP7-funded ongoing project running through 2016, analyzing how transition initiatives for supporting urban sustainability can be accelerated and scaled up. The ARTS project and its framework are presented in these factsheets [in English (pdf, 682.8 kB)] [på svenska (pdf, 1.1 MB)] Read more COMPLEX: With 17 partners across 11 European countries this project, funded by EU FP7, aims to explore new energy technologies, new ways of using landscapes and new policy instruments to support the transition towards a low carbon society by 2050. Read more EKOKLIM 4: An interdisciplinary research programme hosted by six departments at Stockholm University. The overarching aim is to investigate how climate change impacts biodiversity and ecosystem services and how they can be managed in the Mälardalen region, Sweden. The programme is financed by FORMAS, 2010-2014. Read more SEEN: This cross-thematic project, led by the Programme on Ecosystem Change and Society (PECS), focuses on social-ecological dynamics of ecosystem services in the Norrström drainage basin in Sweden. SEEN explores the dynamics that contribute to the reliable production of ecosystem services in social-ecological systems. As part of the project a pilot resilience assessment is being undertaken together with Eskilstuna Municipality. Read more
URBES Urban Biodiversity and Ecosystem Services is a BiodivERsA-funded project aiming to bridge the knowledge gap between researchers and policymakers on urban development trends, biodiversity and ecosystem services in selected cities in Europe and New York City. The project runs from 2012 through 2014. Read more
Contributors
M. Meacham, Borgström, S., Norberg, J.
References
Barthel, S., J. Colding, T. Elmqvist, and C. Folke. 2005. History and local management of a biodiversity-rich, urban, cultural landscape. Ecology and Society 10(2):10. [online] URL: http://www.ecologyandsociety.org/vol10/iss2/art10/
Borgström, S. and Schewenius M. (forthcoming) report for the ARTS project (Accelerating and rescaling transitions to sustainability)
Nykvist, B. et al (forthcoming)
Antonsson, H., and U. Jansson. 2011. Agriculture and forestry in Sweden since 1900. Geographical and historical studies. The Royal Swedish Academy of Agriculture and Forestry, Malmö, Sweden.
Borgström, S. 2011 Doctoral thesis http://www.diva-portal.org/smash/record.jsf?pid=diva2%3A382544&dswid=-1689
Cousins, S. A. O. 2009. Landscape history and soil properties affect grassland decline and plant species richness in rural landscapes. Biological Conservation 142:2752-2758.
Darracq A, Greffe F, Hannerz F, Destouni G and Cvetkovic V 2005 Nutrient transport scenarios in a changing Stockholm and Mälaren valley region Water Sci. Technol. 51 31-8 http://www.iwaponline.com/wst/05103/wst051030031.htm
Destouni, G., F. Jaramillo, and C. Prieto C. 2013. Hydro-climatic shifts driven by human water use for food and energy production. Nature Climate Change 3:213-217.
Elmhagen, B., G. Destouni, A. Angerbjörn, S. Borgström, E. Boyd, S. A. O. Cousins, L. Dalén, J. Ehrlén, M. Ermold, P. Hambäck, J. Hedlund, K. Hylander, F. Jaramillo, V. K. Lagerholm, S. W. Lyon, H. Moor, B. Nykvist, M. Pasanen-Mortensen, J. Plue, C. Prieto, Y. Van der Velde, and R. Lindborg. 2015. Interacting effects of change in climate, human population, land use, and water use on biodiversity and ecosystem services. Ecology and Society XX(YY): ZZ.
Emanuelsson, U. 2010. The rural landscapes of Europe: how man has shaped European nature. The Research Council Formas, Stockholm, Sweden.
Queiroz, C., Meacham, M., & Richter, K. (2015). Mapping bundles of ecosystem services reveals distinct types of multifunctionality within a Swedish landscape. Ambio. Retrieved from http://link.springer.com/article/10.1007/s13280-014-0601-0
Van der Velde, Y., N. Vercauteren, F. Jaramillo, S. C. Dekker, G. Destouni, and S. W. Lyon. 2014. Exploring hydroclimatic change disparity via the Budyko framework. Hydrological Processes 28: 4110-4118.
Leave a Comment